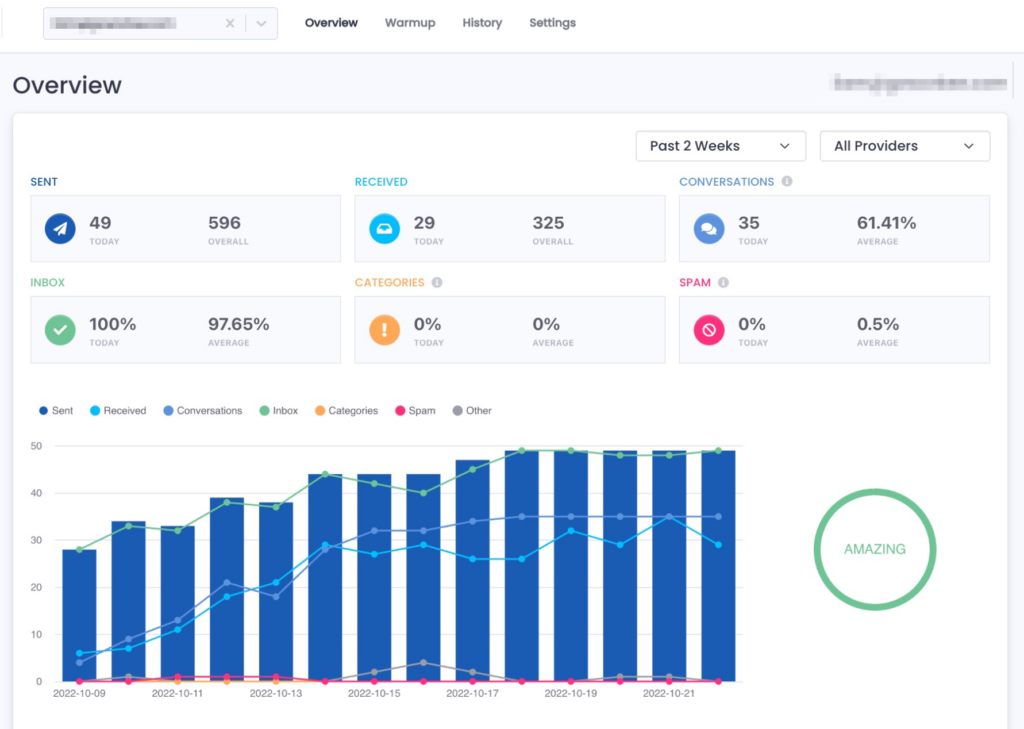
In the Overview tab, you can see the data on your email sending and receiving for any particular connected email.
You can also change the parameters of this data by clicking the dropdowns for the date range, as well as see how your emails have fared among different providers.

This data includes:
- Emails sent today and overall
- Emails received today and overall
- Conversations (emails that are replied to) today and on average for this warmup
- Inbox percentage today vs. average
- Categories percentage today vs. average
- Spam percentage today vs. average
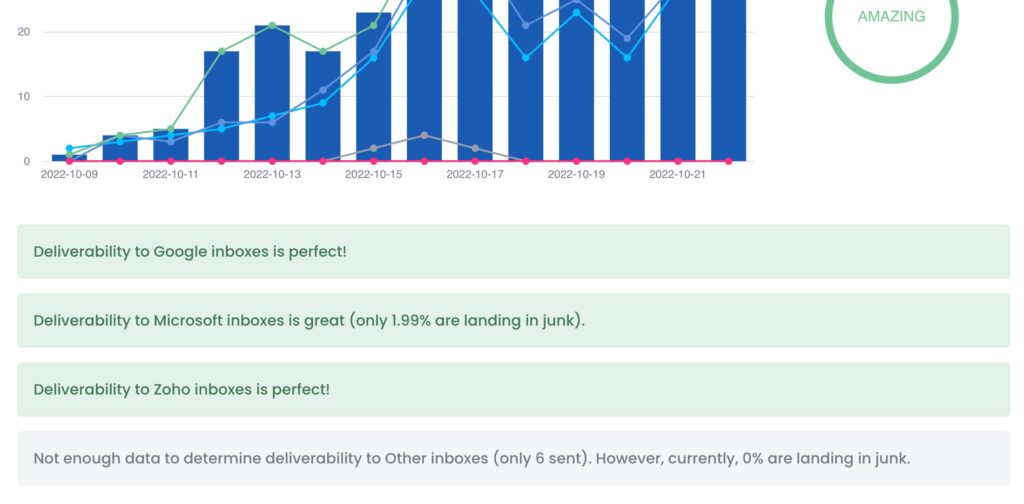
Below that section there is a bar chart that visualizes these data points over the time period.
On the right side is your sending score.
And below that, you have feedback on how your emails are performing among different email providers’ inboxes.


 in Boston.